

More than 60 countries held elections in 2024, shaping a new world order amid a wave of anti-incumbent voting. The US presidential election — which marked Donald Trump’s return to the White House — was arguably the most consequential election of the year, with populist rhetoric and headlines raising fears that the global energy transition could be halted, or reversed, amid ongoing pledges to “drill, baby, drill”.
But let’s separate rhetoric from reality by focusing on the trend lines, not the headlines:
- The economics have never been better — Falling costs, technological breakthroughs and encouraging clean-tech learning curves have reduced the cost of clean energy below that of fossil fuels in many regions. Roughly 81% (382 GW) of newly installed renewable power projects in 2023 were cheaper than fossil fuel alternatives.1 The energy transition is no longer a matter of averting global warming, but of basic economics and good business. Emerging economies, with their increasing power demands and rapid urbanization, should accelerate the adoption of clean energy, especially solar energy, purely for affordability reasons.
- Energy autonomy = energy security — In the wake of Russia’s invasion of Ukraine, and the resulting surge in gas prices which sparked Europe's most significant energy crisis since the 1970s, most EU countries have accelerated renewable energy deployment. China also continues to strengthen its resilience to global oil and gas price volatility through expanded renewable energy initiatives. It installed a staggering 358 GW of solar and wind capacity in 2024,2 a 45% and 18% year-on-year increase from end-2023 levels, respectively. As geopolitical disruptions continue to create oil and gas price volatility, more countries could follow their lead.
- China dominates clean energy supply chains — In 2024, global investment in clean energy reached $2 trillion (USD),3 double the investment in fossil fuels. While America’s retreat from the clean energy space might not look good, it is already a relatively small player in the space, accounting for only around 15%3 of global clean energy investment. As such, it has limited ability to affect the trajectory of the global energy transition. China dominates global clean-tech supply chains, at every stage, across multiple technologies and could capitalize on America’s retreat to build on an already commanding lead and solidify its market leadership position.
The technological and economic tailwinds powering the clean energy transition are just too strong for a single nation, or head of state, to overcome. The Trump administration’s policies might slow (not halt) the US transition but could harm US competitiveness in the clean-tech space, allowing China to pull further ahead. The transition in the rest of the world will likely power ahead. So, as the US embraces “drill, baby, drill” while much of the rest of the world increasingly adopts a “build, baby, build” stance towards renewables, the real question is: Will America be left behind in the great energy transition?
Better (and continuously improving) economics
Costs for constructing new wind and solar installations have decreased substantially in recent years, eliminating a key barrier to widespread adoption. The levelized cost of electricity (LCOE) measures the average cost of electricity generation over the lifetime of a power plant. The global weighted average LCOE of newly installed utility-scale solar PV projects fell by 90% over 2010-2023, making it 56% lower than the average cost of fossil fuels in 2023. Offshore and onshore wind have seen similar (albeit less dramatic) cost declines. In 2023, the global weighted average LCOE of new onshore wind projects was 67% lower, and offshore wind was 25% less expensive, compared to the weighted average cost of fossil fuels. Roughly 81% (382 GW) of newly installed renewable power projects in 2023 were cheaper than fossil fuel alternatives. Globally, new solar and wind projects are priced lower on production costs compared to new gas and coal plants in nearly every market, according to BNEF (Bloomberg New Energy Finance).4
Moreover, once installed, clean energy systems are, in general, relatively cheap to maintain. The adoption of renewable power has saved an estimated $409 billion (USD) in fuel costs globally in the electricity sector over 2000-2023.5
The LCOE of solar PV was 56% lower than fossil fuels in 2023 |
The LCOE of onshore wind was 67% lower than fossil fuels in 2023 |
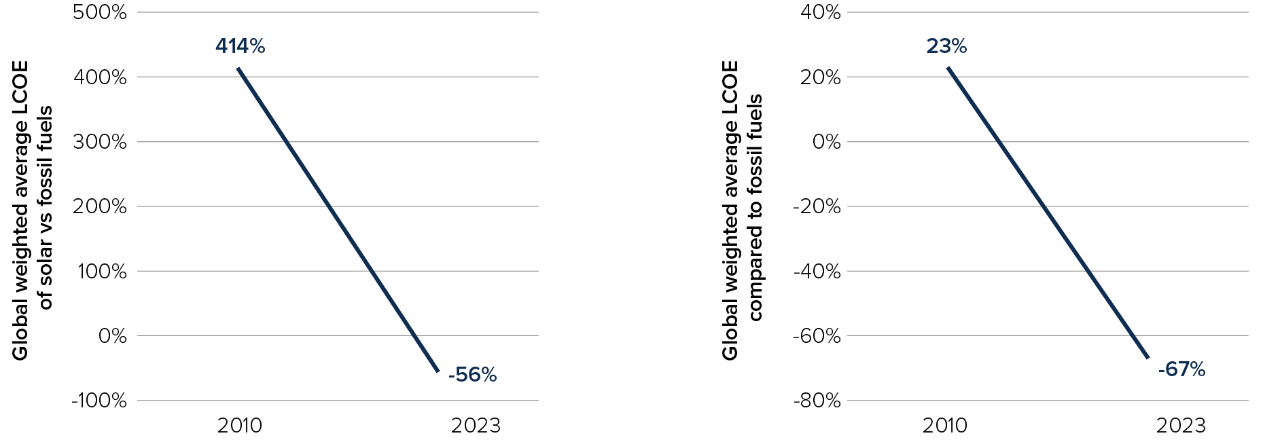 Source: IRENA
Why is it that renewable energy continues to become cheaper, while fossil fuels haven’t seen similar efficiency gains? Wright’s Law. In its simplest terms, with each doubling of production of an item, its costs decrease by a certain consistent percentage. In other words, renewable energy technologies are following steep learning curves: each doubling of installed solar and wind capacity results in price declines of roughly 20%.6 Similarly encouraging learning curves on batteries (the most expensive component of an electric vehicle (EV), have led to sharp cost declines over the last decade, which could, in turn, continue to drive down prices of EVs leading to mainstream adoption.
Energy autonomy in a time of geopolitical disruption
The EU has an ambitious plan to achieve energy costs savings of around €260 billion annually by 2040.7 A large part of this plan hinges on ensuring that electricity bills will not be dictated by volatile gas prices, through the accelerated deployment of renewable energy and associated grid infrastructures. Crucially, this structural shift could strengthen the region’s energy security by reducing its vulnerability to imported gas from Russia, an issue that rose to the forefront of EU policy agendas in the wake of Russia’s 2022 invasion of Ukraine. The subsequent surge in gas prices forced European nations to seek cheaper and cleaner energy options. In the aftermath, fossil fuels have lost their hold on the EU energy market: renewable energy's share has grown from 34% in 2019 to 47% in 2024,8 while the share of fossil fuels has decreased from 39% to a low of 29%. Wind and solar capacity added since 2019 has helped the EU to avoid €59 billion worth of fossil fuel imports.
This isn’t an isolated phenomenon. About six billion people reside in countries that depend on fossil fuel imports,9 exposing them to oil and gas price volatility caused by geopolitical disruptions. Many of these countries are investing heavily in domestic renewable energy projects. China, for example, added a staggering 358 GW of solar and wind capacity in 2024, a 45% and 18% year-on-year increase from end-2023 levels, respectively. Similarly, India installed 24 GW of renewable energy (primarily solar energy) in 2024,10 corresponding to more than half of New York State’s entire net summer electricity capacity.11 The IEA, in its main case scenario, projects 5,500 gigawatts (GW) of new renewable capacity to become operational by 2030, with China accounting for 60% of this expansion.12
Renewable electricity capacity growth in GW by country/region, 2017-2030
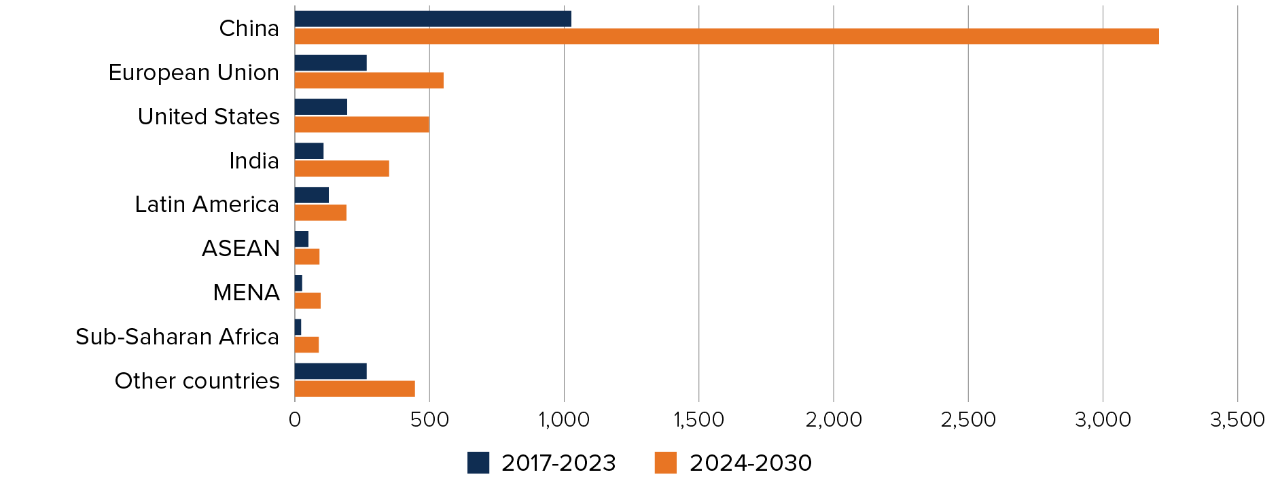 Source: International Energy Agency (IEA)
Who wins in America’s retreat from the clean energy stage?
Global clean energy investment reached $2 trillion (USD) in 2024, double the investment in fossil fuels. As this gap continues to widen in tandem with accelerated investments in clean energy, China should be the biggest beneficiary of the projected growth. It already has a commanding lead across clean-tech supply chains ranging from solar panels and EVs to batteries, as well as a virtual monopoly on the processing and refining of critical minerals which are essential for the energy transition. If the US chooses to promote domestic oil and gas production over investing in reshoring of clean-tech supply chains, it could leave a clear path for China to build on an already commanding lead and solidify its market leadership position. To put it in context:
- Chinese auto brands accounted for over 60% of global EV sales in 2024.13
- Fewer than 3% of the solar panels installed in the EU are manufactured in Europe.14
- China accounts for 60% of production of rare earth elements and processes 85% of them.15 Rare earth elements (the collective term for a group of 17 metals) are used in renewable energy technologies (EV batteries, solar panels and wind turbines) as well as general consumer electronics.
Share of global manufacturing capacity in clean-tech segments
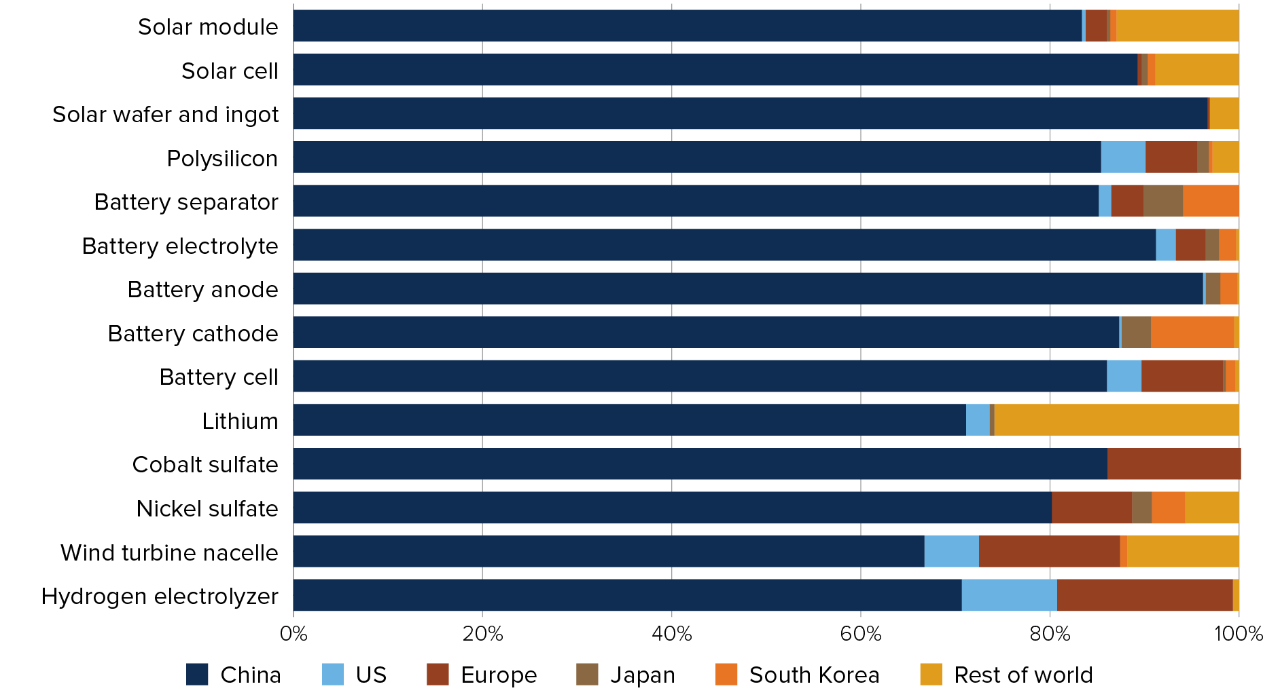 Source: Bloomberg NEF
Conclusion
The decline in renewable energy costs, driven by technological advancements and steep learning curves, has favourably positioned clean energy to undercut fossil fuels in terms of production costs. Moreover, the global shift towards renewables is not only an economic imperative but also a strategic move to enhance energy security amidst geopolitical uncertainties. As the clean energy transition accelerates, it could unlock a vast array of new opportunities for investors who are willing to take a long-term view. As winners and losers emerge, making informed choices will be essential for investors in positioning their portfolios to effectively navigate what could be the greatest structural shift in our society since the Industrial Revolution.
Sources:
1: IRENA – International Renewable Energy Agency Renewable Power Generation Costs in 2023 Report
2: Renewable energy accounts for 56 pct of China's total installed capacity The State Council, The People’s Republic of China
3: Overview and key findings – World Energy Investment 2024 – Analysis - IEA International Energy Agency
5: IRENA – International Renewable Energy Agency Renewable Power Generation Costs in 2023 Report
7: New action plan to save €260 billion annually on energy by 2040 - European Commission
8: European Electricity Review 2025 | Ember
9: WWF: (3) Post | LinkedIn
10: Press Release:Press Information Bureau
11: New York Profile
13: Visualizing Chinese EV Market Share Overseas
14: Europe launches subsidies probe into Chinese wind turbine suppliers | CNN Business
15: Could Africa replace China as the world’s source of rare earth elements?
Commissions, trailing commissions, management fees and expenses all may be associated with mutual fund investments. Please read the prospectus before investing. Mutual funds are not guaranteed, their values change frequently and past performance may not be repeated.
This content (including facts, views, opinions, recommendations, descriptions of or references to, products or securities) is not to be used or construed as investment advice, as an offer to sell or the solicitation of an offer to buy, or an endorsement, recommendation or sponsorship of any entity or security cited. Although we endeavour to ensure its accuracy and completeness, we assume no responsibility for any reliance upon it.
May contain forward-looking information which reflect our or third party current expectations or forecasts of future events. Forward-looking information is inherently subject to, among other things, risks, uncertainties and assumptions that could cause actual results to differ materially from those expressed herein. These risks, uncertainties and assumptions include, without limitation, general economic, political and market factors, interest and foreign exchange rates, the volatility of equity and capital markets, business competition, technological change, changes in government regulations, changes in tax laws, unexpected judicial or regulatory proceedings and catastrophic events. Please consider these and other factors carefully and not place undue reliance on forward-looking information. The forward-looking information contained herein is current only as of March 31, 2025. There should be no expectation that such information will in all circumstances be updated, supplemented or revised whether as a result of new information, changing circumstances, future events or otherwise.
This article is based on the opinion of the author based on independent research that has not been separately verified by Mackenzie.